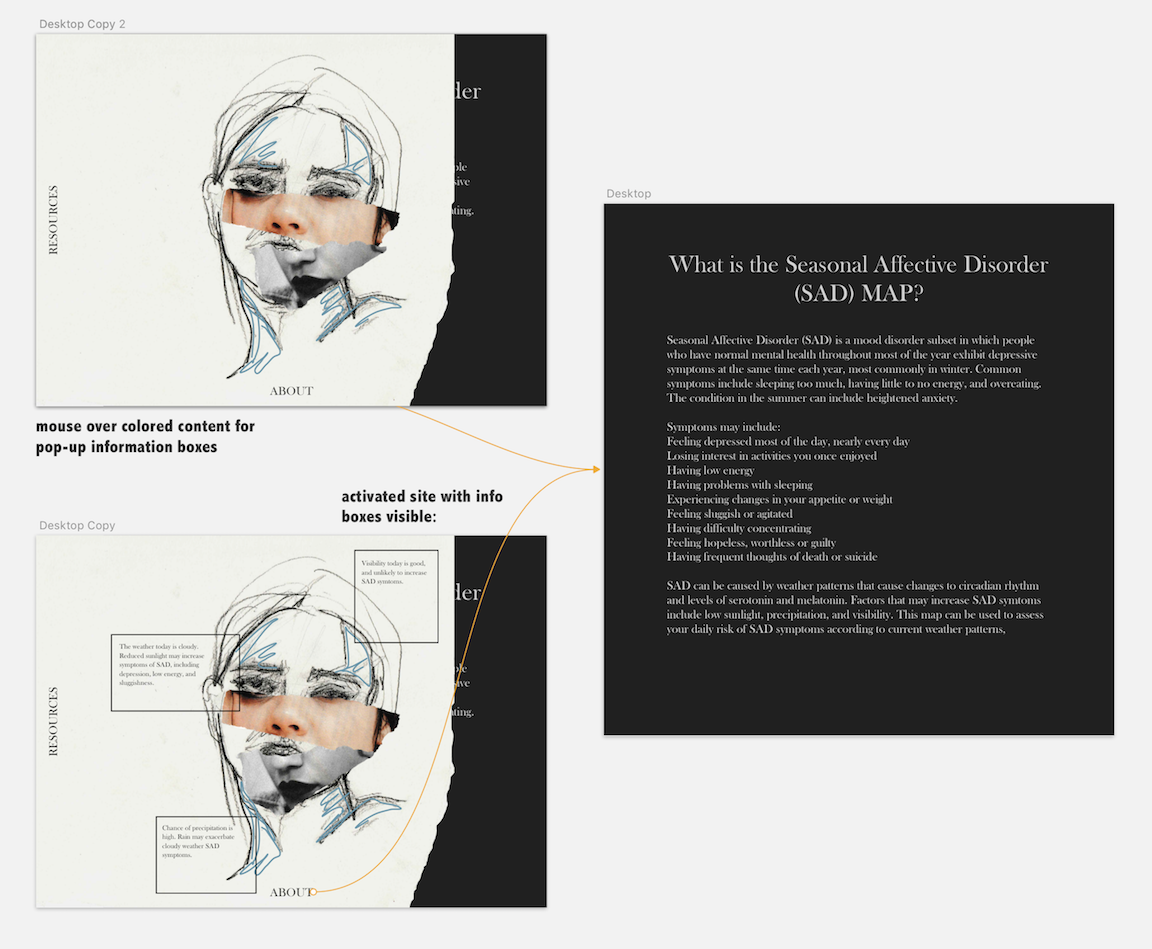
This project uses the OpenWeatherMap API to report daily risk of Seasonal Affective Disorder (SAD) in New York City. The site reports symptom risk through changing collage elements that convey mood according to sun, visibility, and precipitation. In this exercise, I experimented with different methods of displaying the symptom report: the first approach utilizes a hover effect that encourages the user to mouse over content for pop-up information boxes to appear. The second approach uses hand-drawn boxes that are visible as soon as the user enters the site.

Findings: Viewers preferred the second prototype, which features hand-drawn info boxes that are visible as soon as the user enters the webpage. This second design felt visually cohesive with the other analog collage elements, and viewers preferred information that was immediately accessible and added to the overall visual aesthetic of the collage. My final design will take this approach, and positioning of collage elements including info boxes, magazine cuts, and illustation will be positioned more loosely for greater web functionality and visual abstraction.